One-sided right-tail F-distribution table for α = 0.025 Distribution (α = 0.025 in the Right Tail) Numerator Degrees of Freedom
The Correct Answer and Explanation is:
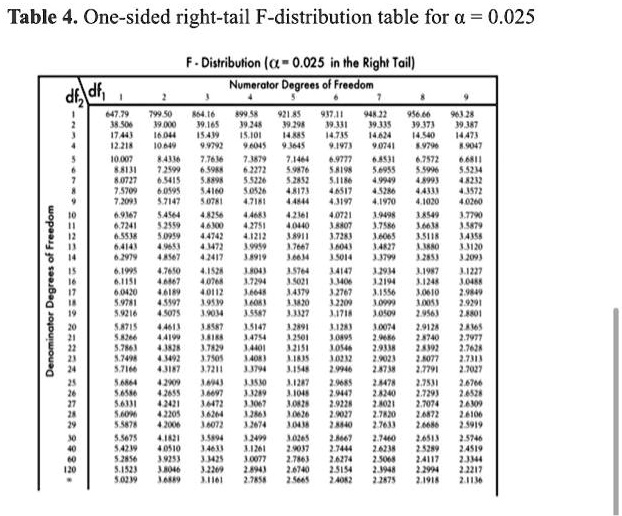
This image displays a statistical reference table for the F-distribution, specifically for a one-sided, right-tail test with a significance level (alpha or α) of 0.025.
This table is a fundamental tool used in inferential statistics, most notably for conducting an Analysis of Variance (ANOVA) or other F-tests. Its primary purpose is to provide critical F-values. A critical value is a threshold used in hypothesis testing. If a calculated F-statistic from a study or experiment exceeds this critical value, the result is considered statistically significant, leading to the rejection of the null hypothesis.
The table is structured with two sets of degrees of freedom (df), which are essential parameters for the F-distribution. The “Numerator Degrees of Freedom” (df1) are listed horizontally across the top columns. In an ANOVA context, df1 typically represents the degrees of freedom between groups (the number of groups minus one). The “Denominator Degrees of Freedom” (df2) are listed vertically down the first column. This value, df2, usually corresponds to the degrees of freedom within groups (the total number of observations minus the number of groups).
To use the table, one must first determine the numerator and denominator degrees of freedom from their data. For instance, to find the critical value for a test with df1 = 5 and df2 = 15, you would locate the column labeled ‘5’ and the row labeled ’15’. The value at the intersection of this column and row is 3.5764. If your calculated F-statistic is greater than 3.5764, you can conclude that there is a statistically significant effect or difference at the 0.025 significance level.