The Correct Answer and Explanation is:
The correct answer is 50.
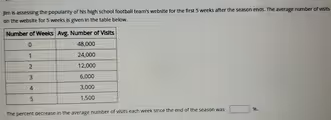
To find the percent decrease in the average number of visits each week, we can use the formula for percent change. The formula is: ((Original Value – New Value) / Original Value) * 100. We need to apply this calculation to consecutive weeks from the table to determine if the rate of decrease is constant.
Let’s first calculate the percent decrease from Week 0 to Week 1.
The original value (visits at Week 0) is 48,000.
The new value (visits at Week 1) is 24,000.
First, we find the difference in visits: 48,000 – 24,000 = 24,000.
Next, we divide this difference by the original value: 24,000 / 48,000 = 0.5.
Finally, we convert this decimal to a percentage by multiplying by 100: 0.5 * 100 = 50%.
So, the decrease from Week 0 to Week 1 was 50%.
To confirm this is the constant weekly decrease, let’s perform the same calculation for the next interval, from Week 1 to Week 2.
The original value (visits at Week 1) is 24,000.
The new value (visits at Week 2) is 12,000.
The difference in visits is: 24,000 – 12,000 = 12,000.
Now, we divide this difference by the original value for this period: 12,000 / 24,000 = 0.5.
Converting to a percentage gives us: 0.5 * 100 = 50%.
The pattern continues for the entire dataset. For example, from Week 2 (12,000 visits) to Week 3 (6,000 visits), the number of visits is halved, which represents a 50% decrease. This consistent reduction, where the number of visits is cut in half each week, confirms that the weekly percent decrease is constant. This type of change is characteristic of exponential decay. Therefore, the percent decrease in the average number of visits each week since the end of the season was 50%.