The Correct Answer and Explanation is:
The correct answer is C) Truck/SUVs have become an important part of the market.
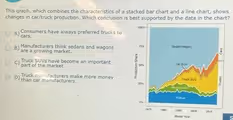
This conclusion is the most accurate interpretation of the visual data presented in the stacked area chart. The graph illustrates the changing production shares of different vehicle types from approximately 1975 to 2015. To understand why option C is correct, one must analyze the trends of each colored section over this time period.
At the beginning of the chart, around 1975, the vast majority of the market is dominated by “Sedan/Wagon,” represented by the large blue area. The categories for “Truck SUV” (light green) and “Car SUV” (yellow) are extremely small, constituting only a minor fraction of total vehicle production. This indicates that during this early period, SUVs were not a significant factor in the automotive market.
However, as you follow the timeline to the right, a dramatic shift becomes apparent. Starting in the 1980s and accelerating through the 1990s and 2000s, the combined share of Truck SUVs and Car SUVs grows substantially. The yellow and light green sections expand upwards, progressively occupying a larger percentage of the total market share. By the end of the period shown, these two SUV categories together make up a very large portion of the market, rivaling the shrinking share of sedans and wagons. This clear and sustained growth from a niche product to a major market segment directly supports the conclusion that Truck/SUVs have become an important part of the market.
The other options are not supported by the data. Option A is incorrect because sedans and wagons clearly dominated the market for many years, showing consumers did not always prefer trucks. Option B is false because the shrinking blue area for sedans and wagons indicates it is a declining market, not a growing one. Option D cannot be confirmed, as the chart shows production share, not financial data like revenue or profit margins.