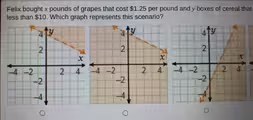
The Correct Answer and Explanation is:
The correct answer is the second graph.
To determine the correct graph, we must first translate the given scenario into a mathematical inequality. Let x represent the number of pounds of grapes and y represent the number of boxes of cereal.
The cost of the grapes is $1.25 per pound, so the total cost for x pounds is 1.25x. The problem does not state the cost of a box of cereal, but we can deduce it from the graphs. Let’s call the cost of one box of cereal C. The total cost for y boxes is Cy.
Felix spends “less than $10” in total. This gives us the inequality:
1.25x + Cy < 10
Now, we analyze the boundary line represented by the equation 1.25x + Cy = 10. We can find the intercepts.
To find the x-intercept, we set y = 0:
1.25x = 10
x = 10 / 1.25
x = 8
So, the x-intercept is (8, 0).
To find the y-intercept, we set x = 0:
Cy = 10
y = 10 / C
Looking at the first two graphs, which have the correct negative slope, the y-intercept is at (0, 4). We can use this to find C:
4 = 10 / C
4C = 10
C = 10 / 4 = 2.5
So, a box of cereal costs $2.50.
Our final inequality is 1.25x + 2.50y < 10.
Let’s check the features of the graph for this inequality.
- Line Style: The inequality is “less than” (<), not “less than or equal to”. This means points on the line are not part of the solution. Therefore, the boundary line must be dashed. Both the first and second graphs have a dashed line.
- Shaded Region: We test a point, like the origin (0, 0), to see which side of the line to shade.
1.25(0) + 2.50(0) < 10
0 < 10
This is a true statement, so we must shade the region that includes the origin, which is the area below the boundary line. - Domain: Since x and y represent physical quantities, they cannot be negative (x ≥ 0, y ≥ 0). The graph must be in the first quadrant.
The second graph matches all these criteria. It has the correct dashed boundary line, the shading is below the line, and the solution is confined to the first quadrant. The first graph is incorrect because it shades above the line. The third graph is incorrect because its line has a positive slope.