The Correct Answer and Explanation is:
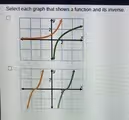
The correct choice is the second graph.
To determine which graph shows a function and its inverse, we must use the key graphical property that defines inverse relationships. The graphs of a function and its inverse are always reflections of each other across the diagonal line y = x. This means that for every point (a, b) on the function’s graph, the corresponding point (b, a) must exist on the inverse’s graph. Additionally, for a curve to be a function, it must pass the vertical line test, meaning any vertical line drawn on the graph can only intersect the curve at a single point.
Let’s analyze the second graph first. It features two curves that are perfect mirror images of each other across the line y = x. If you were to fold the graph paper along that diagonal line, the orange curve would land exactly on top of the green curve. Furthermore, both the orange curve and the green curve individually pass the vertical line test. Any vertical line you could draw would only cross each curve once. Therefore, this graph correctly depicts a function (one curve) and its inverse function (the other curve). These curves are visually similar to the function y = x³ and its inverse, the cube root function y = ³√x.
Now let’s examine the first graph. While the two curves shown are indeed reflections of each other across the line y = x, there is a critical issue. The green curve, which resembles a square root function, does pass the vertical line test and is a function. However, the orange curve, a parabola opening to the right, fails the vertical line test. For example, a vertical line at x = 1 would intersect the orange curve at two points, y = 1 and y = -1. Because the orange curve is not a function, this graph does not show a function and its inverse function. It shows a function and its inverse relation. Therefore, only the second graph correctly fulfills all the required conditions.