The Correct Answer and Explanation is:
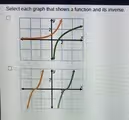
The correct choice is the first graph, the top option.
The relationship between a function and its inverse is defined by a specific geometric property. The graph of an inverse function is a reflection of the original function’s graph across the diagonal line y = x. This reflection occurs because the process of finding an inverse function involves swapping the x and y variables. Consequently, every point (a, b) on the original function corresponds to a point (b, a) on its inverse.
In the top graph, this reflectional symmetry is clearly present. If you were to draw the line y = x, which passes through the origin with a slope of 1, you would see that the orange curve and the green curve are mirror images of each other across this line. We can test this by examining key features. The orange function has a horizontal asymptote at y = -2 and a y-intercept near (0, -1). Its inverse, the green function, correctly has a vertical asymptote at x = -2 and an x-intercept near (-1, 0). This consistent swapping of x and y coordinates confirms that the two curves represent a function and its inverse. The orange curve appears to be an exponential function, while the green curve is its corresponding logarithmic inverse.
Conversely, the bottom graph does not show this relationship. While both curves have a similar shape, the green curve is not a reflection of the orange curve across the line y = x. Instead, the green curve appears to be a horizontal translation, or a shift to the right, of the orange curve. A translation is a fundamentally different geometric transformation from a reflection. If we take a point on the orange curve, such as the origin (0, 0), its reflection would also be (0, 0), which is true for the green curve. However, if we take another point on the orange curve, like one near (1, 2), its inverse point should be near (2, 1). The green curve does not pass through that point. Therefore, the two functions in the bottom graph are not inverses of each other.