The Correct Answer and Explanation is:
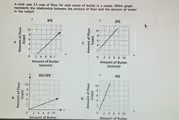
The correct answer is Graph A.
This problem describes a proportional relationship between the amount of flour and the amount of butter. To find the correct graphical representation, we must identify the graph that accurately shows this specific proportion.
First, we need to understand the relationship given: 2.5 cups of flour are used for every 1 ounce of butter. In a graph, the independent variable, which is the amount of butter in this case, is plotted on the horizontal x-axis. The dependent variable, the amount of flour, is plotted on the vertical y-axis. The relationship can be expressed with the equation y = 2.5x, where y is the flour and x is the butter.
A key feature of any proportional relationship is that its graph is a straight line passing through the origin (0, 0). This makes sense because using zero ounces of butter would require zero cups of flour. All four graphs show lines passing through the origin, so we must check the specific points on each line to find the correct slope or ratio.
Let’s test a point on Graph A. If we look at 2 ounces of butter on the x-axis, the line corresponds to 5 cups of flour on the y-axis. To see if this matches the recipe, we can calculate the ratio of flour to butter: 5 cups / 2 ounces = 2.5 cups per ounce. This perfectly matches the recipe’s requirement. We can test another point for confirmation. At 4 ounces of butter, the graph shows 10 cups of flour. The ratio is 10 cups / 4 ounces = 2.5 cups per ounce.
Now let’s briefly look at the other options. Graph B shows 4 cups of flour for 10 ounces of butter, a ratio of 0.4, which is incorrect. Graph D shows 10 cups of flour for 2 ounces of butter, a ratio of 5, which is also incorrect. Therefore, Graph A is the only option that correctly visualizes the relationship.